Figure 4.26: Viewing Model Statistics
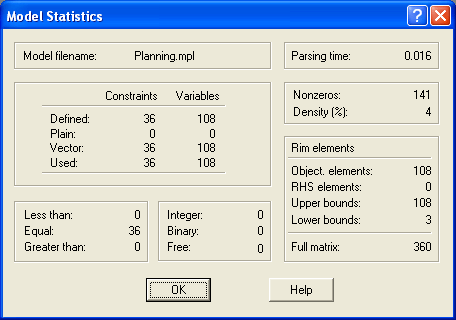
To see the problem statistics choose Model Statistics from the View menu. This will display the Model Statistics dialog box shown here below in Figure 4.26.

Figure 4.26: Viewing Model Statistics
The top line of the model statistics window contains the name of the model file. On the right is the time it took to parse the model.
n the left, in the middle of the window, is a table containing the number of constraints and variables. If you defined variables in the DECISION VARIABLES section of the model, but didn't use them all in the model, the Defined variable count will be higher than the Used variables. The Plain and Vector variable count tells you how many of the variables were plain and how many were defined as vectors.
At the bottom of the window, to the left, the constraints are divided into Less Than, Equal, and Greater Than constraints. In the next section, to the right, the number of variables that are Free, Integer, or Binary variables are listed.
To the right, in the middle of the window, are the number of nonzeros and the matrix density. Below, in the lower right-hand corner, the number of objective function coeffi- cients, the right hand side (RHS) coefficients, and the upper and lower bounds are listed. Finally, at the bottom, it shows the total number of nonzero elements for the full matrix that were stored.