Figure 4.32:
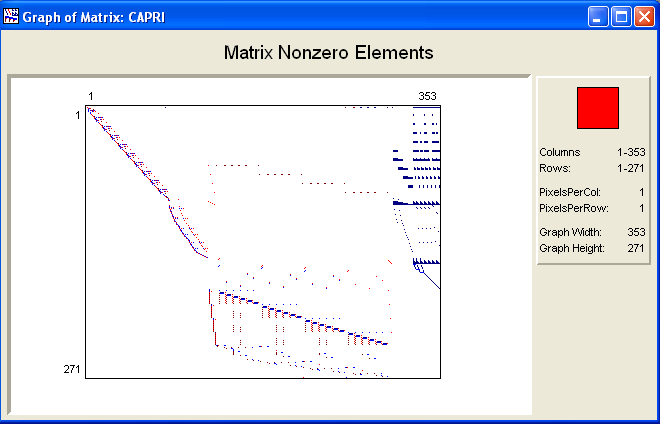
To display a graph of the matrix nonzero elements, choose Matrix from the Graph menu. You can also press the Graph Matrix button in the Toolbar.

Figure 4.32:
The graph shows all the positive numbers in blue color and all the negative numbers in red color. Furthermore, numbers that have binary values (1 and -1) are showed in lighter blue and lighter red respectively.
You can use the mouse to zoom into the matrix. Place the mouse cursor in the upper-left corner of the part of the matrix you want to zoom into. Hold the left mouse button down while you drag the mouse down and to the right. This will draw a box that shows the area that will be zoomed. When the box is the correct size release the left mouse button to zoom.
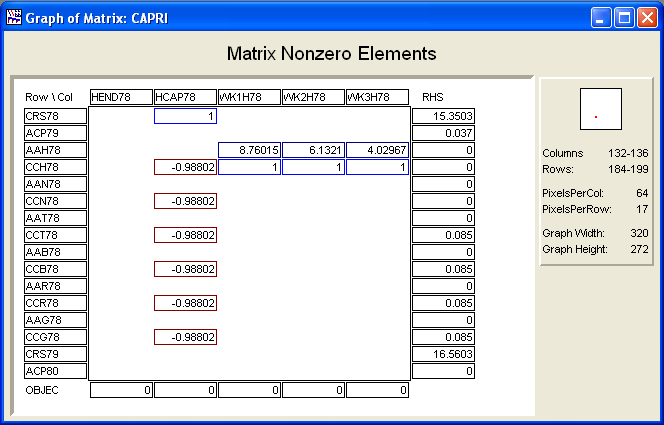
You can repeat the zoom several times until you reach the spreadsheet view. This will allow you to see the actual values and the names of each cell in the matrix. You can also reach the spreadsheet view by clicking with left mouse button on the part of the matrix you want to see.

Figure 4.33: The Spreadsheet View of Matrix
You can move around in the matrix using the arrow keys. The red dot in the small box in the upper right-hand corner shows you were you are located in the matrix. To zoom back out click the right mouse button.